Is the Shale Gas Revolution for Real?
Some have described the proliferation of shale gas plays as a “quiet revolution.” But, the revolution is not so quiet. Stories now appear regularly on the front page of the Philadelphia Inquirer, the New York Times, and many other newspapers far from the oil patch. What are the facts?
US natural gas production is higher than it has been over the last 30 years. On a twelve month rolling basis, US natural gas withdraws as of July, 2006, were 23.1 trillion cubic feet (TCF) (see note below). Current annual US natural gas withdraws are 26.5 TCF, a 15% increase in less than five years.

Examination of the data from the last five years on a month-over-month basis highlights the steady upward progression of natural gas production in the US.

The increase in US natural gas production has been driven largely by increases in shale gas production. US shale gas production has increased dramatically as shown in the table below:
| Increase | ||||
| Year | TCF | TCF | % | |
| 2007 | 1.3 | – | – | |
| 2008 | 2.2 | 0.9 | 69% | |
| 2009 | 3.3 | 1.1 | 50% | |
| 2010 | 4.9 | 1.6 | 48% | |
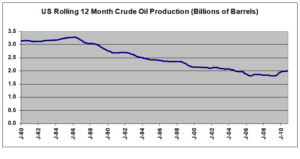
By contrast, annual US crude oil production has declined significantly since peaking at 3.6 billion barrels in 1971. Currently, US crude oil is being produced at a rate of about 2 billion barrels per year. This is a 44% decline from the 1971 peak.
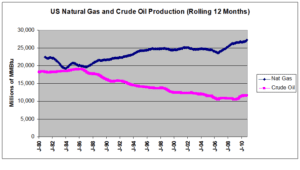
The stark divergence in the trends of natural gas and crude oil production in the US stands out even more when the production levels of the two forms of energy are converted to a common energy unit. The graph below presents US natural gas and crude oil production in millions of mmBtus. A mmBtu is a million Btus. Conversion factors of 1,025 Btus per cubic feet of natural gas and 5.8 mmBtu per barrel for crude oil were used.
The discussion above has focused on natural gas production. Natural gas reserves have increased even more dramatically. The DOE Energy Information Administration recently estimated US recoverable unproved shale gas reserves at 827 TCF, 474 TCF more than their estimate last year.
So, what could derail the natural gas revolution, “quiet” or otherwise? The short answer is public sentiment related to two environmental concerns; (i) potential groundwater contamination, and (ii) the disposal of drilling and fracking fluids.
The failure of a well’s casing can lead to drilling or fracking fluids seeping into fresh water aquifers. Generally, fresh water aquifers are encountered in the first few hundred feet of a well while shale gas reserves exist thousands of feet below. This is not an environmental risk to be ignored. However, over many decades there exists a successful track record of keeping ground water aquifers isolated from formation fluids (natural gas, crude oil, natural gas liquids and formation water). The same techniques and technologiescan be applied to keeping groundwater aquifers isolated from fracking fluids.
The improper disposal of drilling and fracking fluids poses a serious threat to surface ecosystems as such fluids can contain toxic materials. Effective regulation and enforcement of the handling and disposal of these fluids is imperative. Recently, the development of fracking fluids using chemicals “sourced entirely from the food industry” has been announced. In any case, the disclosure of detailed information about the chemicals used in its fracking fluids is critical.
Note: Natural gas and crude oil production and reserve data was obtained from the US Department of Energy, Energy Information Administration website.
The Avalon Advantage – Visit our website at www.avalonenergy.us, call us at 888-484-8096 or email us at jmcdonnell@avalonenergy.us.
Copyright 2011 by Avalon Energy Services, LLC.