Natural Gas Prices – Get Real
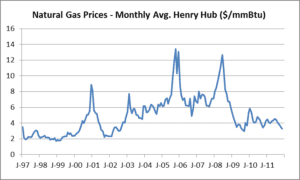
Previous articles on the topic of natural gas prices have looked at natural gas prices spanning the 179 month period of time running from January 1997 through November 2011 (click here, here, and here for more information). Here is a graph of the dataset.
Each time we have used this graph, we have noted that these natural gas prices are in “nominal” dollars, or dollars unadjusted for inflation. Readers have asked how natural gas prices have behaved on an inflation adjusted, or “real,” basis.
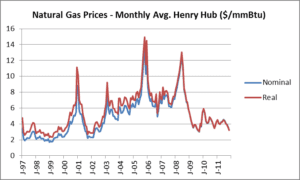
The blue line in the graph above shows natural gas prices in nominal dollars while the red line shows natural gas prices adjusted for inflation. Prices were adjusted using U.S. Bureau of Labor Statistics (BLS) Consumer Price Index (CPI) inflators. In other words, prices are presented on an apples-to-apples basis in constant year 2010 dollars.
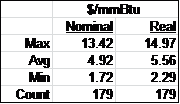
In “real” dollars, natural gas prices, over the 14 year and 11 month period of time, averaged $5.56/mmBtu, reached nearly $15/mmBtu ($14.97/mmBtu) during October 2005, and dropped as low as $2.29/mmBtu during December 1998. During November 2011 (the latest month for which we have data) the monthly average spot natural gas price at the Henry Hub was $3.22/mmBtu.
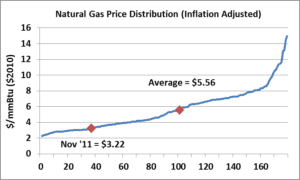
The above graph shows natural gas prices over the study period ranked by price, from lowest to highest. The November 2011 price of $3.22/mmBtu is at the top of the bottom quintile, meaning that over the identified period, 80% of the time natural gas prices, in real dollars, have been higher than they are currently.
The Avalon Advantage – Visit our website at www.avalonenergy.us, call us at 888-484-8096, or email us at jmcdonnell@avalonenergy.us
Copyright 2011 by Avalon Energy® Services LLC