Liquefied Natural Gas (LNG)
The development of a liquefied natural gas export trade was identified in a previous article as an influence that would put upward pressure on natural gas prices. To follow is an overview of where the US liquefied natural gas markets have been and where they may be headed. But first, what is liquefied natural gas?
At atmospheric temperature and pressure, natural gas (methane, CH4) exists in a gaseous state. When cooled to minus 260 degrees F, methane condenses into a liquid state. This liquid form of methane takes up approximately 1/600th the volume of methane in gaseous form and is known as liquefied natural gas or LNG. From a commercial perspective, the distribution of natural gas is limited to the pipeline network natural gas can be delivered into, whereas, because of its much greater energy density (70% that of gasoline), LNG can be transported in cryogenic tanks over long distances by specialized ocean going vessels.
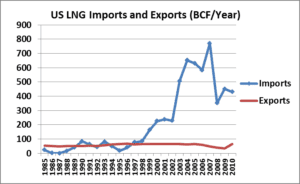
How big is the LNG market in the US? The above graph shows the volume of LNG imports and exports into and out of the US over the twenty-six year period of time spanning 1985 through 2010. [Click on graphs to enlarge.] LNG imports became significant around the turn of the century, peaked at 770 billion cubic feet (BCF) during 2007 and then fell off as natural gas prices dropped precipitously during 2008. During 2010, the US imported 431 BCF of LNG. LNG export volumes have been minor, averaging 58 BCF per year.
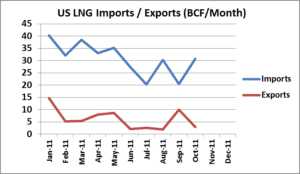
During 2011, the slide in LNG imports continued as shown in the graph above, totaling 350 BCF (estimate).
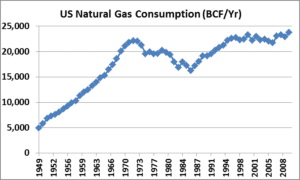
How have LNG imports compared to overall US consumption? Consumption of natural gas in the US rose dramatically from 4,971 BCF during 1949 to 22,101 BCF during 1972, after which it fell to 16,221 BCF during 1986 and then rose to 23,775 BCF during 2010. Over the last 26 years, LNG imports as a share of total US consumption peaked at 3.3% during 2007.
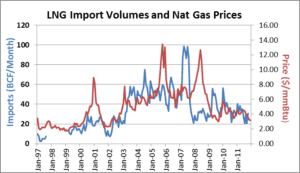
How have LNG import volumes behaved compared to US natural gas prices? These two variables are presented together on the above graph. It is hard to tell much from this graph. We took the above data and lagged (shifted forward in time) the natural gas prices one month at a time and calculated the correlation between LNG import volumes and US natural gas prices.
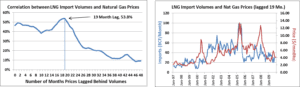
The correlation is highest at 53.8% with a 19 month lag as shown on the left graph above. The graph to the right shows the same volume and pricing data with prices shifted forward 19 months.
So far we have looked at LNG import volumes. What about LNG export volumes? Since 1985, LNG export volumes have been minor, averaging 58 BCF per year. In the current low natural gas price environment (the February NYMEX futures contract settled at $2.32 on 1/19/12) this will change.
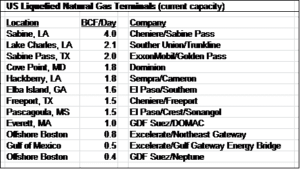
There are twelve LNG import terminals in the US (see table at end of article). Nine applications have been submitted to the Department of Energy seeking permits that would allow facilities to export LNG. Two permit requests have been conditionally approved. One is Cheniere Energy in Sabine, Louisiana and the other is Dominion’s Cove Point facility on the Chesapeake Bay.
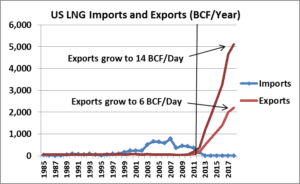
Exports of 6 BCF per day, or 2,190 BCF per year, are equivalent to 9.8% of current US natural gas consumption. The nine facilities that have applied for export permits, together, seek to ship about 14 BCF of natural gas per day. If they are all successful, exports would grow to 5,110 BCF per year, or the equivalent of 22% of current US natural gas consumption.
This is a stunning change in the US LNG trade and will certainly create upward pressure on natural gas prices in the US. The range of estimates of the price increase impact of each BCF per day of exports, according to ICF, are from $0.02 to $0.30 per mmBtu. EIA’s estimates for each BCF of exports range from $0.07 to $0.17 per mmBtu.
The Avalon Advantage – Visit our website at www.avalonenergy.us, call us at 888-484- 8096, or email us at jmcdonnell@avalonenergy.us.
Copyright 2012 by Avalon Energy® Services LLC