Energy Prices Always Go Up (continued)
As discussed on this blog, there is a common perception that energy prices have been, and continue to be, on a one way path upwards. In previous posts we focused on natural gas and showed that rather than rising, natural gas prices have, in fact, fallen dramatically, over both the short run and the long run (see hereand here).
Electricity prices in PJM continued to fall last year as well.
First some background. PJM is the independent electric grid operator in the Mid-Atlantic and parts of the Mid-West and is responsible for the reliability of the electric transmission system and, equally importantly, managing the market for wholesale electricity and related services throughout its operating territory (as well as into and out of PJM). Below is a map of the territory PJM covers.

PJM has many pricing points individually referred to as locational marginal prices (LMPs). LMP is the pricing mechanism for wholesale power in PJM. LMPs vary by location when transmission congestion exists. LMPs can be nodal or zonal. Nodes refer to specific buses. Zonal LMPs correspond to PJM transmission zones. Energy prices are established in both the day-ahead and real-time markets. When referring to LMPs over time, they are often presented as “average prices” or as “load weighted average prices.” The later accounts for the amount of load at a node or in a zone during each hour over the total measurement period. All in, PJM keeps track of over 10,000 LMPs.
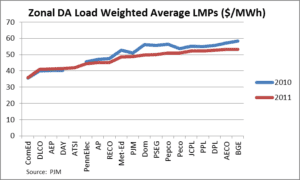
So, back to the story. During 2010, PJM zonal day-ahead load weighted average locational marginal prices averaged $50.92 per megawatt-hour (MWh). This weighted average price dropped to $48.69 per MWh during 2011, a 4.4% decline. LMPs vary significantly by zone, as shown on the graph below.
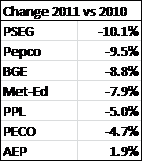
The change in average LMPs between 2010 and 2011 varied considerably by zone. LMPs dropped about 10% in the PSEG and Pepco zones. There were some exceptions to the overall decline in LMPs, such as in the AEP zone, in which the average LMP increased. A sampling of zonal price changes is presented in the table below.
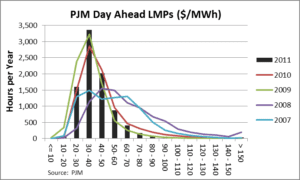
This overall decline can also be seen in the contraction of prices into the lower end of the frequency distribution shown below.
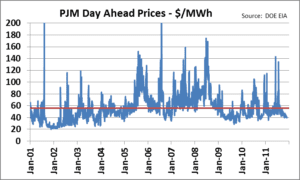
From January 2001 to the present, LMPs in PJM have averaged $55.81 per MWh. Current LMP prices are well below this average, as shown on the graph below (in red).
Do energy prices always go up? The answer is “no” as it relates to electricity and natural gas prices.
The Avalon Advantage – Visit our website at www.avalonenergy.us, call us at 888-484- 8096, or email us at jmcdonnell@avalonenergy.us.
Copyright 2012 by Avalon Energy® Services LLC