Real Energy Cost Savings
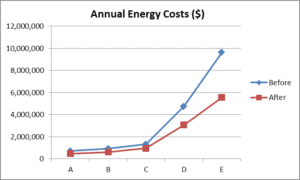
Below are the results from a sampling of reverse auctions conducted for Avalon Energy Services’ customers, including customers of varying size, over the past few months. The first graph shows the customer’s annual energy costs before competitive bidding (blue line) and after contracts were executed on accepted bids (red line). Pre-auction annual energy costs ranged from $0.7 million to $9.6 million, while post-auction costs ranged from $0.5 million to $5.6 million.
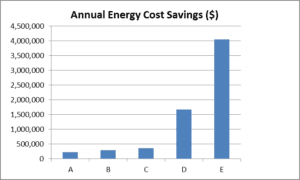
This translates into savings from about $0.2 million to about $4.0 million per year, as shown on the graph below:
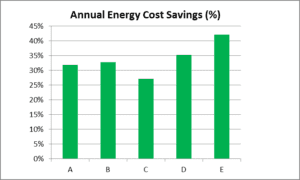
Annual savings on a percentage basis are presented in this third graph and range from 27% to more than 40%.
Of course, past performance is not necessarily an indicator of future results, but in our experience, a well-executed and carefully managed reverse auction will achieve the most advantageous results for a customer. The key is to use a skilled energy consultant who can effectively analyze your needs, customize a solution, and successfully use competitionamong suppliers to bring about the optimal energy procurement outcome.
Evelyn Teel contributed to this article.
The Avalon Advantage – Visit our website atwww.avalonenergy.us, call us at 888-484- 8096, or email us at jmcdonnell@avalonenergy.us.
Please feel free to share this blog. If you do, please email or post the web link. Unauthorized copying, retransmission, or republication is prohibited.
Copyright 2013 by Avalon Energy® Services LLC