What Does a Cold Day Look Like?
In previous blog posts, we have examined how weather and other events affect electricity prices.
What Does a Superstorm (Sandy) Look Like?
What Does a Derecho Look Like?
What Does a Warm Day Look Like?
What Does an Earthquake Look Like?
We continue this series by looking at how electricity prices in the PJM Interconnection area can be affected by cold weather.
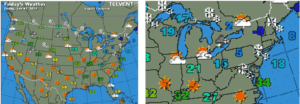
Winter Storm Hercules brought snow and cold temperatures to the northeast United States on Thursday and Friday, January 2 and 3, 2014.
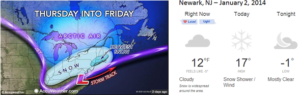
Because of heavy cooling loads, electricity usage and wholesale electricity prices in the PJM area during the summer tend to be substantially higher than usage and wholesale prices during the winter. Most air conditioners are powered by electricity whereas much of the winter heating load is carried by natural gas and, to some extent, fuel oil. However, during times of extremely cold weather, consumers pull out all of the stops. Air circulation equipment runs longer and electric resistance heating kicks in. The result is increased usage and high prices.
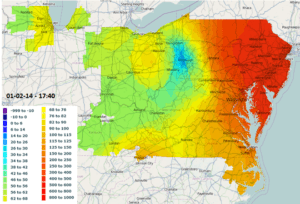
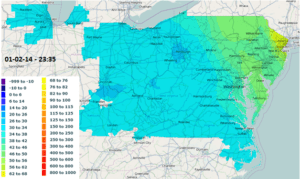
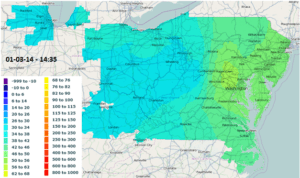
The map below shows real-time wholesale electricity prices at 5:40 PM on January 2. As is typical, electricity prices are higher in the eastern part of PJM (PJM-East), where most of the load is located, than in the western part of PJM (PJM-West), where most of the generation is concentrated. Real-time prices differences in PJM are a result of the costs associated with transmitting electricity from generating facilities (source) to load (sink) and the related line losses. On the map, the price scale in the bottom left corner of the map is in dollars per megawatt-hour ($/MWh).
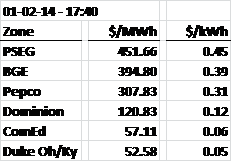
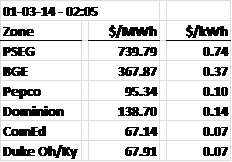
The east-west differentiation in prices is dramatic. The table below shows prices in dollars per megawatt-hour ($/MWh) and dollars per kilowatt-hour ($/kWh) for six delivery zones. For comparison, real-time wholesale prices in PJM averaged $31.21/MWh or $0.03/kWh during 2012.
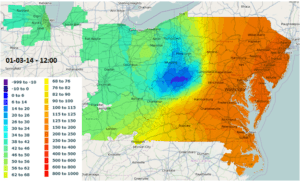
Summer electricity prices also tend to be substantially more volatile than winter prices. But, extreme weather, hot or cold, can drive price volatility and at times, winter prices can exhibit strong volatility. Below is a dramatic example. While prices in North Jersey (PSEG Zone) were high, around $500/MWh, prices in West Virginia and western Virginia were negative.
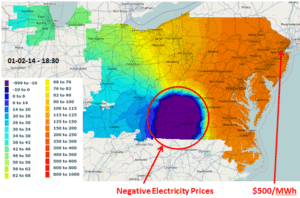
This was a result of transmission constraints brought about by the heavy demand in PJM-East and the inability of many coal fired generating plants in PJM-West to ramp down quickly. In other words, while there was great demand for electricity in PJM-East, there was temporarily insufficient transmission capacity to move electricity from west to east. These transmission constraints developed more quickly than generation in PJM-West was able or willing to curtail their output. The result was that, rather than receive revenues for their output, generators had to pay to deliver their energy into the system.
After a continued day of volatile prices, by 11:35 PM electricity prices had moderated significantly over the entire grid. As shown on the graph below, prices had fallen to the $20/MWh to $40/MWh range.
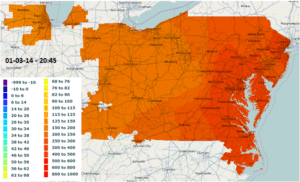
However, Friday, January 3 brought more cold temperatures…
…and more volatility. At 2:05 AM on Friday, January 3, less than three hours after the snapshot above, prices spiked, exceeding $700/MWh in northern New Jersey.
During the remainder of Friday, prices continued to exhibit a strong East-West differentiation…
…but showed some periods of quiescence:
…as well as across the board extremely high prices:
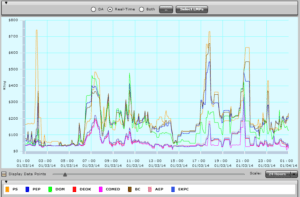
The graph below shows real-time prices throughout the entire day:
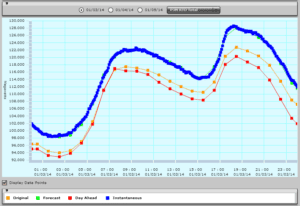
This graph shows PJM total system wide load over the day. Peak demand was 128,611 MW.
The Avalon Advantage – Visit our website atwww.avalonenergy.us, call us at 888-484-8096, or email us atjmcdonnell@avalonenergy.us.
Note: Electricity price data and graphs from PJM.com.
Please feel free to share this article. If you do, please email or post the web link. Unauthorized copying, retransmission, or republication is prohibited.
Copyright 2014 by Avalon Energy® Services LLC