Three Years Ago
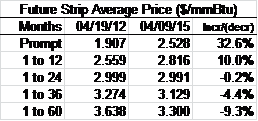
Just about three years ago, on April 19, 2012, the prompt-month (see Note 1) natural gas futures contract closed at $1.91 per mmBtu, a twelve year low. On April 9, 2015, the prompt-month contract closed at $2.53 per mmBtu.
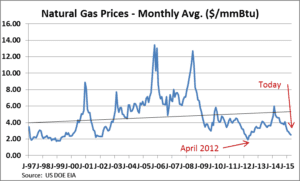
Are natural gas prices higher now, in April 2015, than they were in April 2012?
The answer is yes and no.
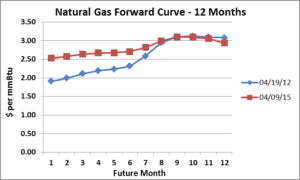
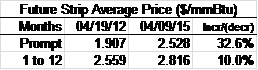
The current prompt-month contract is certainly higher than the prompt-month contract was three years ago. In fact, it is 32.6% higher.
Looking at the 12 month futures-strip (see Note 2), the simple average price (see Note 3) of natural gas is 10.0% higher than it was three years ago.
The simple average price of the 24 month strip is essentially unchanged. But, further into the future, prices are lower than they were three years ago–surprisingly so.
The 36 month strip is 4.4% lower. The 60 month strip is 9.3% lower.
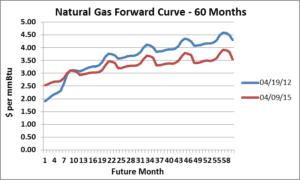
The graph below shows the full term of the futures curves at the two points in time. The current curve is 13.4% lower.
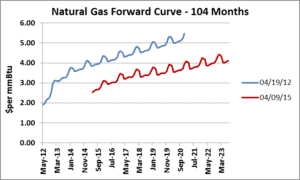

The current prompt-month contract is certainly higher than in April 2012. However, prices further out the futures curve have dropped significantly since. The current futures curve does not even approach $5/mmBtu over its life. The market expects natural gas prices to remain low for a long time. For energy consumers with natural gas load, this market represents a golden opportunity to lock in low prices. How long will this favorable natural gas market last? That is the subject of another article.
Note 1 – The prompt-month contract, also known as the near-month contract, refers to the futures contract month that is closest to expiration. For example, during April 2015, the prompt-month contact was for delivery during May 2015.
Note 2 – Futures-strip refers to futures contracts for two or more sequential delivery months. For example, the 12-month futures strip during April 2015 spans the months of May 2015 through April 2016.
Note 3 – The simple average price of a futures-strip is just that, the simple average of all of the monthly prices in the strip. This is as opposed to a load weighted price in which each monthly price is weighted by the amount of load an energy buyer expects to use during each of the months in the futures-strip.
Data from the US Department of Energy, Energy Information Administration and the Chicago Mercantile Exchange.
The Avalon Advantage – Visit our website atwww.AvalonEnergy.US, call us at 888-484-8096, or email us atjmcdonnell@avalonenergy.us.
Please feel free to share this article. If you do, please email or post the web link. Unauthorized copying, retransmission, or republication is prohibited.
Copyright 2015 by Avalon Energy®Services LLC